Contents
1. Why Distribution Matters More Than Wattage
2. IES Type I to Type V Roadway Patterns
3. NEMA Beam Spread Classifications
4. Why Stadium Optics Need a Different Approach
5. Reading Photometric Data Before Ordering
1. Why Distribution Matters More Than Wattage
A luminaire’s wattage and lumen output do not show where the light will land. Light distribution types describe the angular pattern of luminous intensity. That pattern controls pole spacing, target illuminance, uniformity, glare and spill light. Two fixtures with the same wattage can produce very different results when their optics send candela in different directions.
For wholesalers and project buyers, the useful question is not “Which distribution is best?” but “Which distribution matches the mounting geometry and calculation target?” A roadway, parking perimeter and football pitch use different optical logic. Current options should therefore be checked against the photometric files available through the CPS Lighting product center, not selected from wattage alone.
2. IES Type I to Type V Roadway Patterns
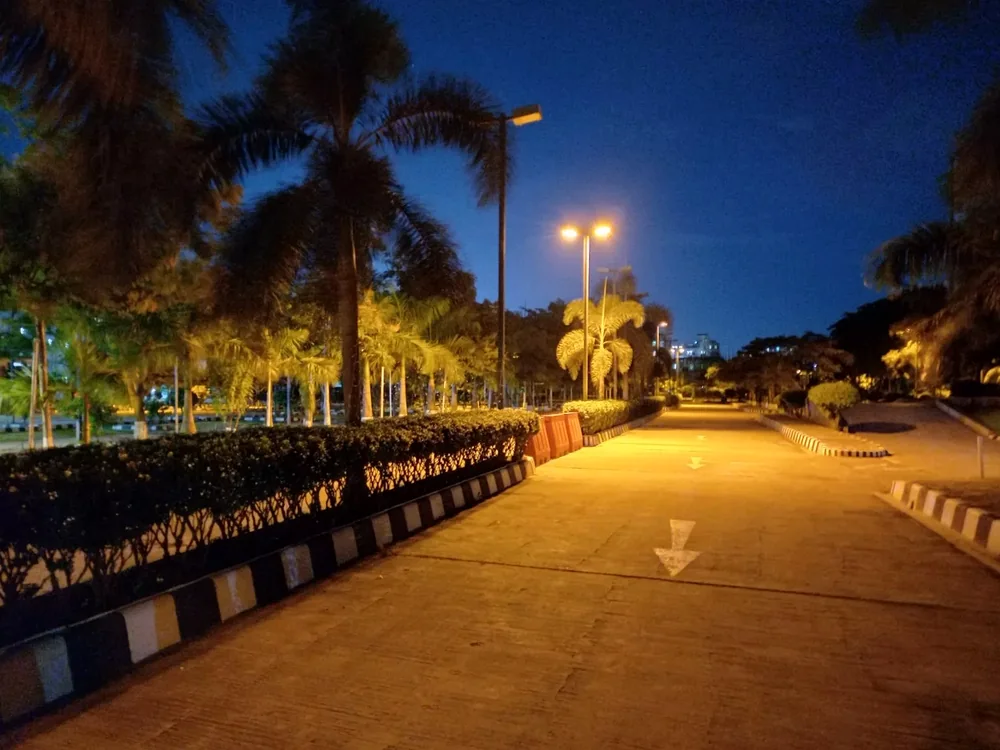
ANSI/IES RP-8 uses Type I to Type V to describe plan-view roadway and parking distributions relative to the luminaire and mounting height. These types are not brightness grades. Type IV does not mean “high output,” and Type V does not automatically mean “stadium lighting.” They describe the shape and principal direction of the candela distribution.
| IES type | Plan-view characteristic | Typical layout context |
|---|---|---|
| Type I | Narrow, elongated two-way pattern | Paths or narrow routes with central placement |
| Type II | Moderate transverse reach | Wider paths and relatively narrow roadways |
| Type III | Broader transverse reach | Roadways and parking-area rows |
| Type IV | Strong forward throw from one side | Perimeter or edge-mounted area lighting |
| Type V | Approximately symmetric around the luminaire | Open areas with central mounting |
Roadway data may also use very short, short, medium, long and very long longitudinal classifications. These relate the maximum-intensity location to mounting height; they are not guaranteed illumination distances. Pole setback, tilt, pavement width and the complete IES file still determine actual coverage.
3. NEMA Beam Spread Classifications
A NEMA beam spread classifies a floodlight’s horizontal and vertical field angles at 10% of maximum candela. This is different from a catalog beam angle commonly measured at 50% of maximum intensity. For an asymmetric designation, the horizontal value comes first. NEMA 7H × 6V therefore identifies angular ranges, not exact angles of 120° by 90°.
| NEMA class | Field-angle range | Relative spread |
|---|---|---|
| 1 | 10° to 18° | Very narrow |
| 2 | 18° to 29° | Narrow |
| 3 | 29° to 46° | Medium narrow |
| 4 | 46° to 70° | Medium |
| 5 | 70° to 100° | Medium wide |
| 6 | 100° to 130° | Wide |
| 7 | 130° and above | Very wide |
4. Why Stadium Optics Need a Different Approach
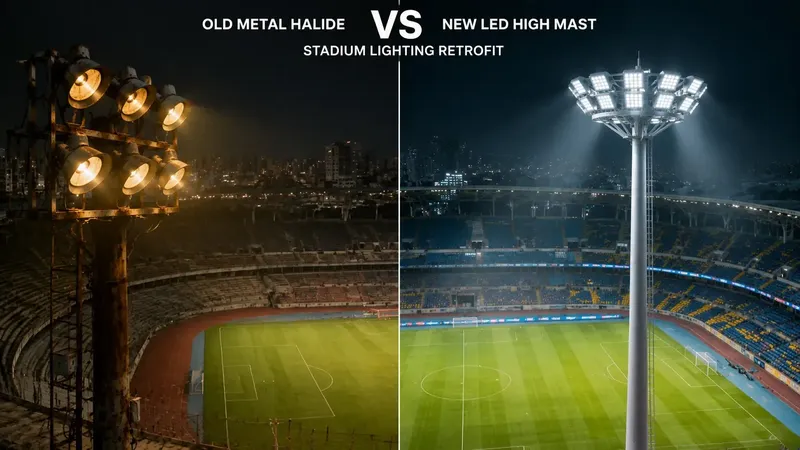
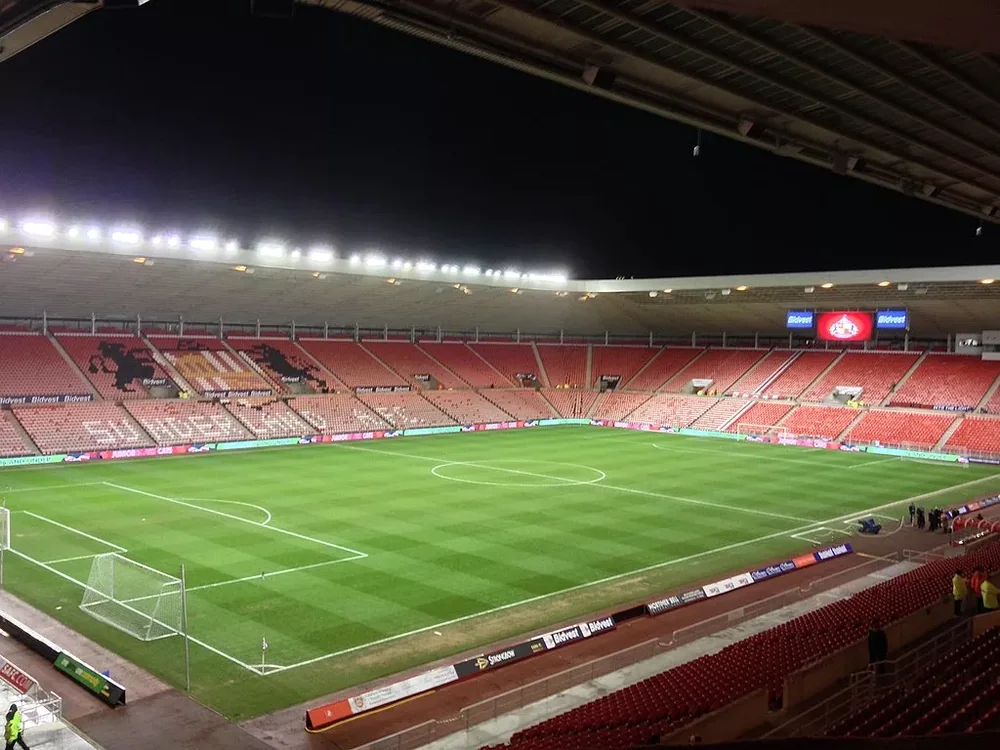
A sports field is not designed by assigning one roadway type to every stadium flood light. High-mast layouts normally combine narrow, medium, wide and asymmetric optics. Far-side targets need concentrated candela, while near-side zones need wider coverage. Beam overlap controls uniformity, but excessive overlap raises glare, spill light and connected load.
CPS reports an 18 m high-pole layout and more than 550 lx average illuminance for its Grade III football field project. The public case does not publish NEMA codes, so none should be inferred. It demonstrates why mounting geometry and measured results matter more than a generic distribution label. CPS discusses this workflow further in its stadium retrofit distribution guide.
5. Reading Photometric Data Before Ordering
Distribution labels are screening tools. The purchase decision should use an IES or LDT photometric file measured for the exact model and optic. Check the polar or Cartesian candela plot, peak intensity direction, horizontal and vertical field angles, zonal lumens and any BUG rating. The IES explains that goniophotometry measures intensity at many angles and stores those data for calculation.
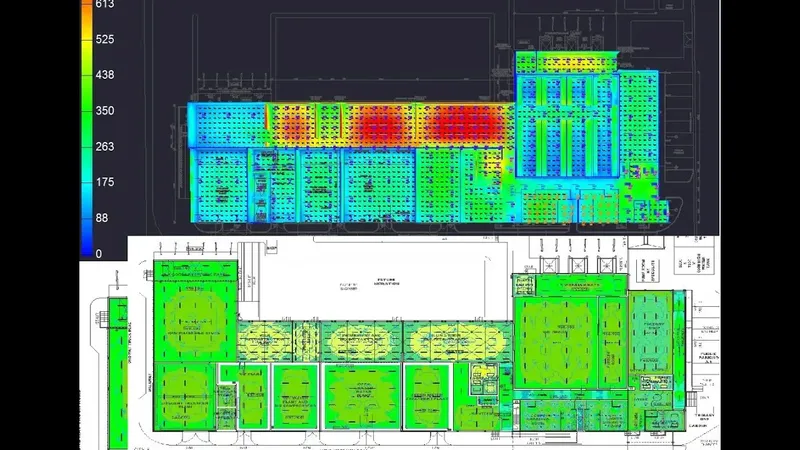
Next, model the real pole coordinates, mounting heights, aiming angles, target grid and obtrusive-light boundaries. A DIALux and AGi32 photometric simulation can compare illuminance, uniformity, glare and spill before hardware is ordered. This is where an optic either proves its suitability or fails it.
6. A Practical Distribution Selection Workflow
Start with the site geometry and task: road width, setbacks, field dimensions, camera directions and property boundaries. Define maintained illuminance, uniformity, glare and spill limits. Shortlist distributions using the appropriate IES roadway type or NEMA spread, then request the exact photometric file rather than relying on a product-family brochure.
Finally, simulate several optic combinations, check pole and bracket constraints, and commission the installed aiming on site. If nearby properties are sensitive, review backlight, uplight and glare using the CPS BUG rating guide. The correct distribution is the one that meets the verified project criteria with acceptable glare, spill, energy and installation cost.
7. Technical Sources
1. ANSI/IES RP-8-22: roadway and parking lighting
2. IES: photometric files and goniophotometry
3. Hubbell Lighting: NEMA beam spread ranges
Core Keywords:
light distribution types, IES Type I to Type V, NEMA beam spread, LED roadway lighting, stadium flood light optics, photometric IES files, DIALux lighting simulation, anti-light spill control, sports lighting supplier