Contents
1.Overlap Is Necessary, but Peaks Need a Reason
Beam overlap is normal in a sports lighting layout. Several luminaires should serve shared zones to support uniformity and visibility from different directions. The warning sign is concentrated light that adds little useful performance while other required areas remain weak.

Consider an illustrative design review: the average lux meets the brief, but a bright centre sits beside darker touchlines. The engineer should inspect point values and group contributions before adding fixtures. The CPS guide to floodlight aiming errors explains how misplaced targets can shift light into an already bright zone.
2.Read the Grid, Not Only the Average
That review starts with explicit statistics. Record Eavg, Emin and Emax on the same calculation area. Define Emin/Eavg and Emin/Emax rather than relying on a ratio label whose meaning may vary between reports. Two designs can share an average yet have different local peaks.
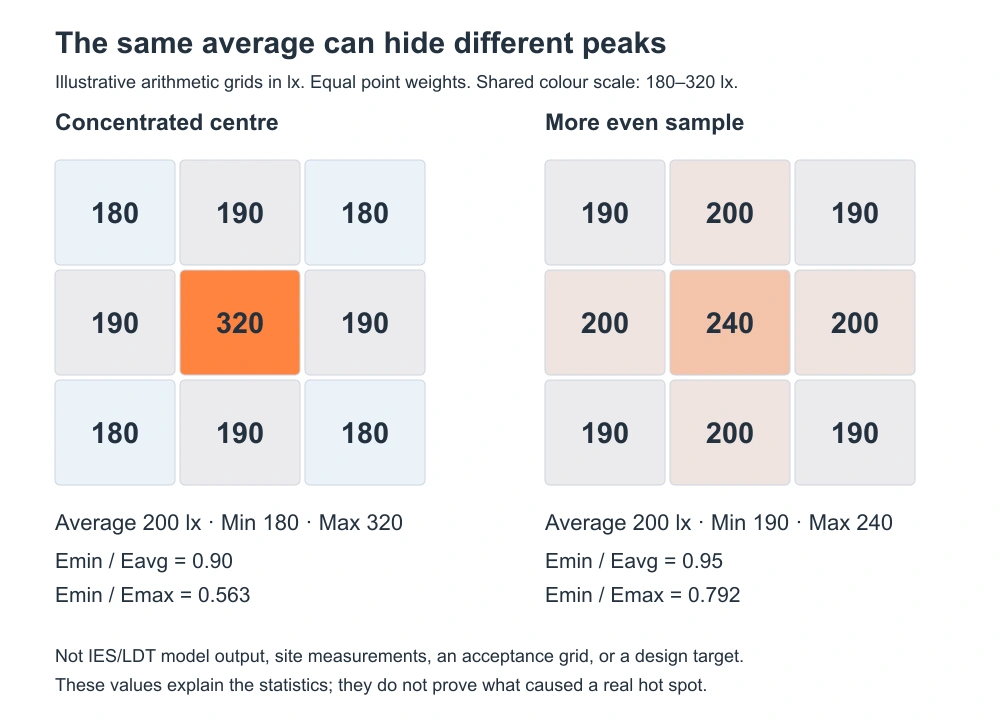
The arithmetic example below uses nine equally weighted points. Both samples average 200 lx. One reaches 320 lx; the other reaches 240 lx. Their Emin/Eavg values are 0.90 and 0.95. These are teaching values, not recommended sports-lighting levels, acceptance grids, or evidence that either layout complies with a standard.
Illustrative equal-weight samples only. Swipe the table sideways on a narrow screen.
3.Trace the Peak to Its Sources
The statistics show where to investigate, not what caused the problem. For a fixed point and plane, illuminance contributions add: Etotal = E1 + E2 + …. A point receiving 120, 110 and 90 lx totals 320 lx. The beam-angle coverage guide explains why a nominal beam outline cannot replace point-by-point photometry.
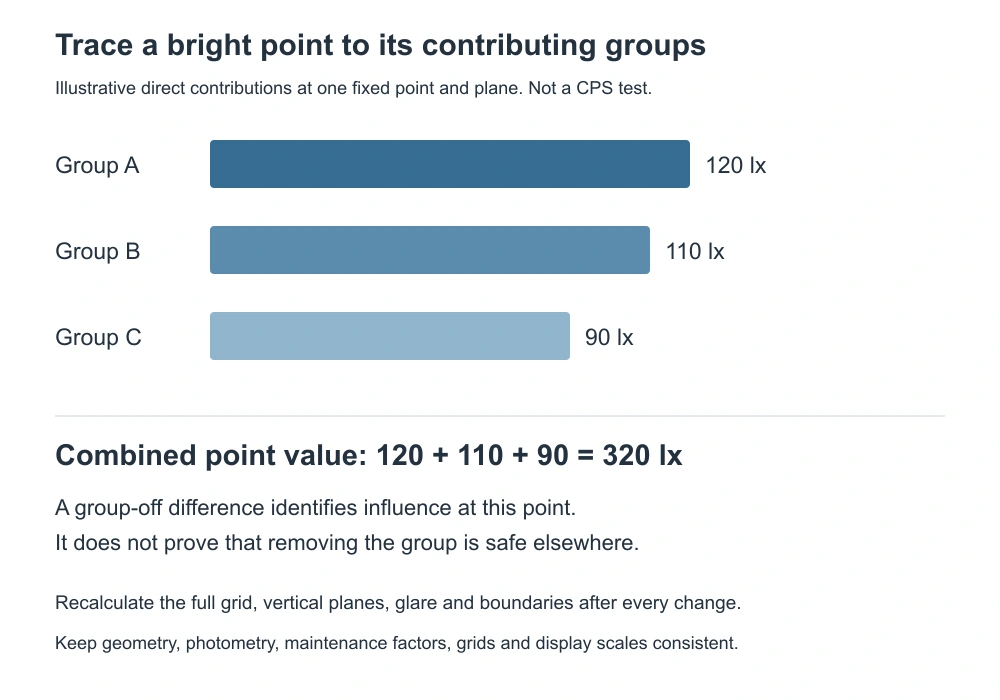
Calculate relevant luminaire groups separately, or compare the baseline with one group disabled while other settings stay fixed. The difference reveals that group’s influence. It does not prove the group is unnecessary: the same luminaires may support a weak edge or a required vertical plane. In reflected-light models, retain consistent surfaces and solver settings.
4.Use Common Scales and Suitable Grids
That source check must use comparable plots. Keep the calculation plane, area, point spacing, maintenance assumptions, operating scene and colour limits unchanged. The CPS photometric simulation guide introduces model inputs. A plot that rescales its colours automatically can look smoother without a meaningful numerical improvement.
AGi32 documentation explains that isolines interpolate between calculated points. A narrow peak missed by the points may also be absent from the contours. Add local diagnostic points when needed, but retain the prescribed acceptance grid. A changed grid or area changes the comparison basis; a smooth rendering alone cannot prove uniformity.
5.Change One Variable, Then Check the Whole Field
Once the contributing groups are known, test target redistribution before removing equipment. Where appropriate, compare a different optic using its verified IES/LDT file. The CPS symmetric and asymmetric optics comparison sets out these choices. A smaller local peak is useful only if the remaining required zones still meet the brief.
Use a controlled sequence: re-aim one group, recalculate all required planes, then compare the same numerical outputs. Review vertical illuminance, shadows, applicable glare checks and property receptors as well as horizontal lux. Dimming can lower a hotspot, but it can also lower the minimum. Re-aiming or changing optics can increase boundary light even when average field lux decreases.
6.Connect the Review to Project Evidence
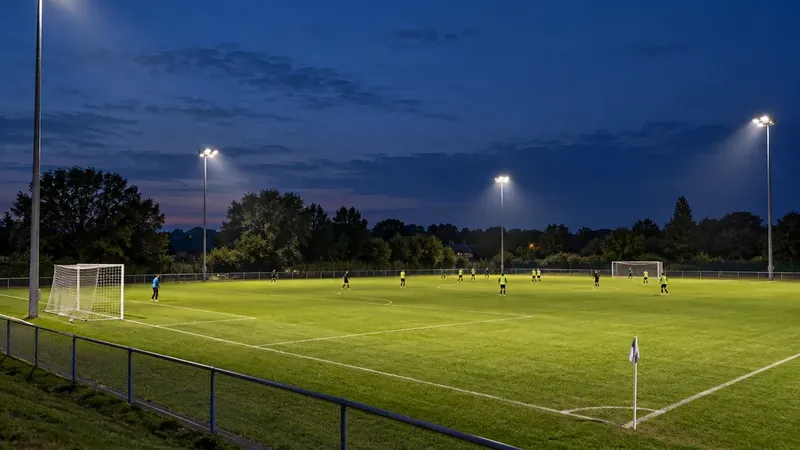
CPS describes a Grade II campus-field retrofit serving student activities and amateur matches. Its published account reports replacing 26 metal-halide lamps with 22 LED luminaires. This supports evaluating a complete replacement layout. It does not establish an ideal overlap percentage, and the photograph cannot verify point values or prove that overlap caused a peak.
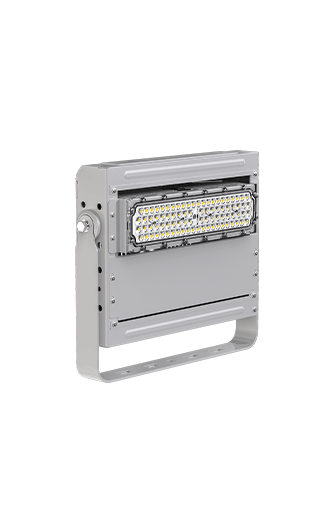
For equipment such as the Dubhe Projection Light 1000W, request the selected optic’s photometry, fixture IDs, coordinates and target schedule. Ask for baseline and revised grids, group-contribution checks, operating scenes and calibrated commissioning records. The acceptance decision should follow the venue’s complete brief, not an attractive rendering or the lowest fixture count.
7.Technical Sources
Keywords: sports lighting layout, beam overlap, sports lighting uniformity, floodlight aiming, illuminance grid, Eavg, Emin, Emax, Emin/Eavg, group contributions, photometric simulation, isolux plots, IES files, LDT files, glare control, spill light.